Arduino Project 3: How to Build an LED Bar Graph
2026-06-03
Channel: Flirting with Technology (2920 subscribers)
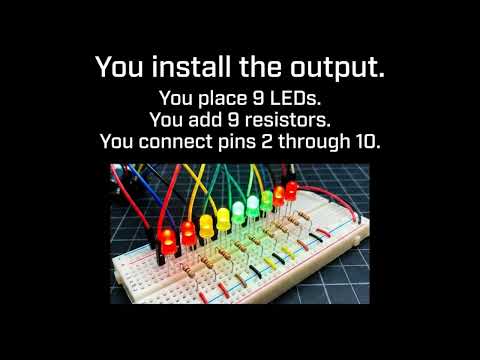
Of the candidates on offer today, this one stands out as the most genuinely educational. Most of the others are Shorts, hashtag-spam kit promos, or vague "student presentation" clips with no concrete content. This video tackles Project 3 from the official Arduino Project Handbook: the LED bar graph.
The bar graph is a deceptively rich beginner project. On the surface, you're just lighting up a row of LEDs in sequence based on a potentiometer reading. Underneath, it touches several foundational concepts worth internalizing: analog-to-digital conversion (mapping a 0–1023 ADC reading to a discrete number of lit LEDs), the map() function for range scaling, iterating GPIO pins inside a for loop instead of writing ten digitalWrite calls, and thinking about current-limiting resistors for an LED array.
It's also a useful stepping stone — bar graphs show up everywhere as VU meters, battery indicators, sensor visualizers, and tuning displays. Once you understand the mapping logic, you can swap the potentiometer for a microphone, a thermistor, or a distance sensor and have a working readout instantly.
At 2.9k subscribers, the channel is firmly in small-creator territory and is methodically working through the Handbook project by project, which is a nice format for following along.
